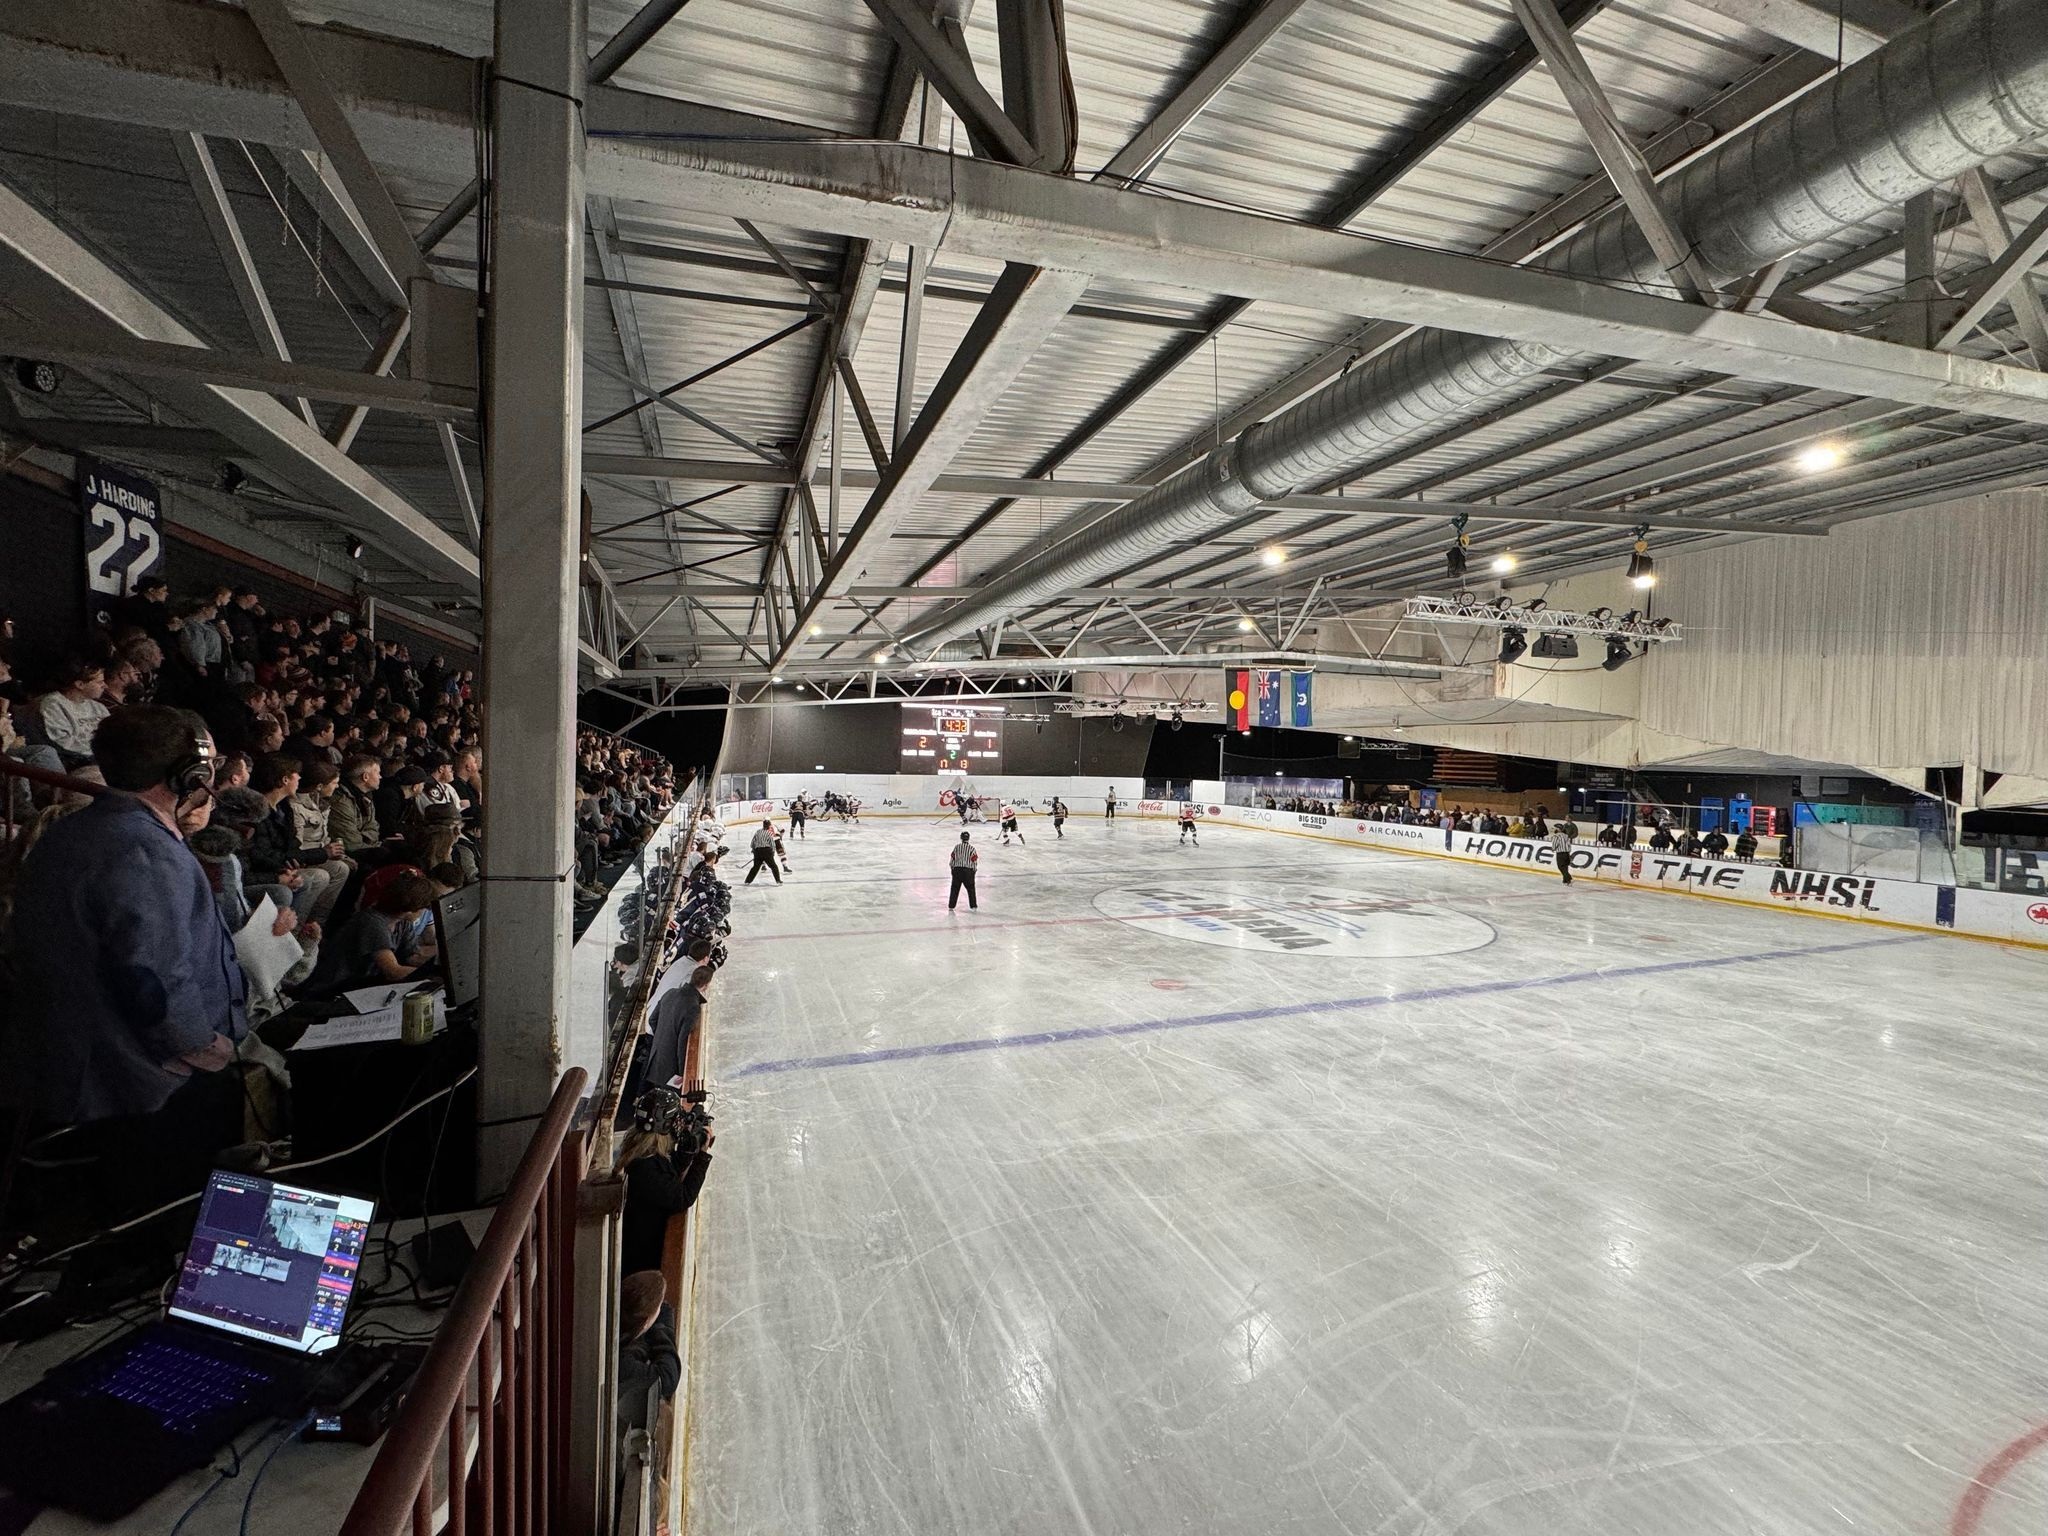
The Australian Ice Hockey League is played out of a wide variety of different venues. These wrinkles (sometimes literal) lead to different performances across the league and this is what this piece looks at – across the AIHL from 2013 to 2023.
This won’t take into account any of the 2024 AIHL season, for the deeply scientific reason of my being away, and I can’t be bothered updating the numbers.
In this period, 12 different venues have hosted AIHL hockey, with the number of games running from a solitary one between the Melbourne Ice and Sydney Bears at Brisbane’s Acacia Ridge rink, to 240 regular season games at the O’Brien Icehouse in Melbourne.
Scoring
So let’s start simple – how does scoring differ by rink?
Figure 1 shows the goal scoring rates at each of the 12 rinks, with the highest scoring being Erina on the Central Coast at 13.85 goals scored per game. Clearly this likely has more to do with the Rhinos’ struggles in 2023 than anything else, as the away team average more than 10 goals per game.
At the other end of the spectrum, aside from the single game at Acacia Ridge, the Perth Ice Arena is the lowest scoring AIHL rink with 7.10 goals scored per game.
If we use the overall league average as a yardstick with 8.06 goals scored per game, the venues with above-average scoring are:
- Erina (Central Coast)
- Ice World Boondall (Brisbane)
- Phillip Swimming & Ice Skating Centre (Brave Cave) (Canberra)
- Hunter Ice Skating Stadium (Newcastle)
- O’Brien Icehouse (Melbourne)
Those where scoring is below league average are:
- Ice World Acacia Ridge (Brisbane)
- Perth Ice Arena
- Sydney Ice Arena, Baulkham Hills
- Penrith Ice Palace (Sydney)
- Liverpool Catholic Club (Sydney)
- IceArena (Adelaide)
- Macquarie Ice Rink (Sydney)
Figure 1: Goals per game by venue

Table 1 splits this scoring amongst home and away teams, and helps shed some light on the situations at some of the outliers. Looking at Erina, it becomes very clear that the high-scoring is related to the Rhinos’ struggles in their return to the AIHL in 2023 – with the second-lowest home team scoring (after the Sydney Ice Arena, and excluding Acacia Ridge), and the only venue where the away team averages over 10 goals per game.
Table 1: Goals scored by venue

*one-off game
This gives us some early indications of how different venues relate to scoring – but is quite blunt. With Perth being the lowest scoring regularly used AIHL rink, is it just the case that the procession of high-quality import goalies the Thunder have had over the years have kept scoring low? Or something about the venue that keeps scoring low?
To begin to answer that question, we now look at shots per game at each venue in Table 2.
Table 2: Shots taken by venue

Starting with the lowest-shooting venues, the two right at the bottom are both in Sydney, and no longer in use in the AIHL – Penrith (which, at 57.28 shots per game is the only venue below 60 shots per game) and Liverpool (60.33). In these, the Bears outshot their opponents in Penrith (by around a shot per game), however the Ice Dogs were outshot in Liverpool – though that is heavily skewed by the 2015 season where the Dogs were one of the worst teams over the period.
Looking at the higher-shooting end of things, similarly to the goal-scoring, Erina takes the cake for the most shots taken – averaging 81.54 per game (and dominated by away teams), but this time Perth has more shots per game than the league average – with 71.48, compared to 66.50. Perth is one of only three venues to average over 70 shots per game, along with Erina and Adelaide – home to teams who have struggled to be fair. Perth is the only one of these venues with more shots from the home team.
This begins to point to the role played by goaltending in determining scoring rates by rink – so we look to save percentages (Table 3).
Table 3: Team save percentage by venue

That just reiterates that Perth is a great place to play for goalies – averaging a save percentage of 0.901, which is by some distance the highest for any venue. The split between save percentages of home and away teams also says a bit about the relative strength of teams in the period as well. Sydney Ice Arena housed the Bears in 2013 and 2014 when they were a struggling team, and their opponents took full advantage – the same with the Rhinos at Erina in 2023.
How do goalies perform?
The numbers discussed above are a nice first-cut of a look at scoring by venue, but they don’t really tell us much about whether a particular AIHL rink is harder or easier to score at – in many cases the strength of the opponent swamps that factor. So how about if we compare goalie performance across venues?
Now, this is slightly different from the overall save percentage as it takes out empty-netters and shootout winning goals which are counted in final scores. Figure 2 and Table 3 show the save percentage by goalies at each venue, and a weighted average (by minutes played) of the variance in save percentage when compared to a goalie’s overall save percentage.
Figure 2: Goalie save percentage and variance by venue

Table 4: Goalie save percentage and variance from overall by venue

We looked at the variance for all goalies in the sample, and just for away goalies on their own – to try and abstract away from the idea that some rinks may get easier with practice.
From this, once again we see that Perth is a goalie paradise – with goalies across the seeing their save percentages increase in their trips west. What is also notable, is the largest positive movement in performance (for venues with more than one game) is in Adelaide, which may also reflect the strength of the home team over the period.
From talking to players, one of the reasons Perth is harder to score at is due to the ice. The ice there is softer than some other rinks, which can slow the game down, giving goalies slightly more chance that at a rink with faster, harder ice (such as Newcastle which has ice closer to being optimised for hockey). Not borne out in the data overall, but a similar situation occurs at Macquarie – especially if you have a sunny day on the big window – the ice at that end does suffer.
More difficult for tendies are Penrith and Canberra – both of which see performances take a hit, but in different ways for home versus away teams. During the Bears’ two-year stint in Penrith they failed to make finals and struggled in general, and this shows with overall goalies having a stronger negative variance than away goalies. Conversely, in Canberra visiting by away goalies has been tougher. But is this the strength of the home team over the period, or the idiosyncrasies of the rink?
Once again though, the strength of the opposition is a bigger factor than the venue.
Diversion – penalties and powerplays
Just because it is a bit interesting (and let’s face it – we’ve all claimed instances of ‘home-town reffing’ before), let’s have a look at how penalty minutes (Table 5) and powerplays (Figure 3 – which shows ‘net powerplays’, which is home powerplays less away powerplays) are distributed.
Table 5: Penalties in minutes (PIM) by venue

Figure 3: Net powerplay opportunities by venue

A few things stick out here. The first is that the most penalised home team were the Ice Dogs when they called Liverpool home – which will surprise absolutely nobody. Aside from Liverpool, the most rink with the most penalty minutes is Canberra – which also won’t surprise anyone as it has the two highest-penalised games of the period (the Brave v Ice doubleheader in 2016).
Something else that sticks out is that only one venue has, on average, had more than one extra powerplay per game for the home team – Boondall in Brisbane, which has had almost 2 more chances on the man-advantage for the Lightning per game than their opponents. Contrast that with Liverpool, where the Ice Dogs gave up one and a third powerplays per game.
How does rink size impact this?
One of the variances between rinks in the AIHL is the size of the surface (aside from other factors such as whether you walk through a toilet to the rink, can stand up fully on the bench, or have to contend with glass or netting). Surfaces range from the smaller end[1] at 55m x 25m (Acacia Ridge, Canberra, Liverpool) to Adelaide which is slightly larger, through to the Olympic-sized rinks in many places.
Comparing scoring in large rinks versus small rinks shows slightly higher in small rinks, but it is less than 0.1 goals per game. This is the case with shots per game as well – with almost two more per game in smaller rinks – but this is all from the away team, with home teams shooting marginally less.
Figure 4: Goals per game – large rinks vs small rinks

Figure 5: Shots per game – large rinks vs small rinks

Overall, the difference between small and large rinks doesn’t really tell much of a story here at all – and this is reinforced by overall save percentages being almost the same across both (0.878 vs 0.880).
Who scores at each venue?
After looking at goalies, now we switch to have a look at who the lead scorer at each AIHL venue is – both overall, and for players who have never called that rink home. This means for someone like Wehebe Darge who has called Adelaide, Canberra and Newcastle home over the period, he isn’t considered an ‘away’ player at any of those. This doesn’t add much analysis to it, but we’re down here in the weeds anyway.
Table 6: Top overall scorer and top away scorer by venue

What’s the point of all this?
Frankly, what we get out of this isn’t a lot we didn’t know anyway. Erina, Boondall and Canberra are high-scoring venues (for various reasons), and Perth and Macquarie are low scoring. Perth is a great place for goalies to play, and the duller, darker confines of the Brave Cave are harder for them.
Once again, shocking revelations in their predictability.
[1] All according to Wikipedia – I didn’t get out a tape measure, though I know someone who has in Canberra.

One response to “Is there really no place like home in the AIHL?”
[…] Is there really no place like home in the AIHL? by Tristan Metcalfe (Hockey Hype Australia, 20 July 2024) […]